Enhancing Snowflake Apps with Streamlit Pagination

Recently, I found myself wrestling with a Streamlit app in Snowflake, tasked with presenting large datasets for user review. However, loading these hefty datasets into a data frame proved sluggish and error-prone, especially with over 400,000 records at play. I stumbled upon a Medium article by Carlos Serrano. He detailed the pagination of Streamlit data frames, sparking an idea: could I adapt his methods to my Snowflake app? The answer was a resounding YES!

The Journey Begins

In this article, I’ll walk you through how I breathed new life into my Snowflake app, adding pagination to clunky datasets. But first, let’s rewind a bit. Remember that NOAA Weather Stations app I tinkered with in a previous article? Well, we’re about to give it a serious upgrade.

Data Loader Function

The first order of business was restructuring my code to accommodate pagination. I added a data loader function to fetch map data efficiently, sprucing up the SQL query with additional fields like station names and distances in miles. To use a single data frame for both the map and table, LAT and LONG must be the first two columns in the data frame. Otherwise, the st.map function will return an error.

##DATA LOADER
@st.cache_data(show_spinner=False)
def map_data_loader(lat_off,long_off,rad):    

    #GET THE NOAA WEATHER STATIONS WITHIN THE RADIUS SPECIFIED
    station_sql = """
    SELECT LONGITUDE,LATITUDE,
    ID AS STATION_ID,
    ST_DISTANCE(ST_MAKEPOINT(LONGITUDE,LATITUDE),ST_MAKEPOINT({long},{lat}))/1609::NUMBER(8,2) AS DISTANCE_IN_MILES
    FROM ST_DEMO_DB.RAW_DATA.NOAA_STATIONS
    WHERE ST_DWITHIN(ST_MAKEPOINT(LONGITUDE,LATITUDE),ST_MAKEPOINT({long},{lat}),{rad}*1609)
    ORDER BY DISTANCE_IN_MILES
    """

    #FORMAT THE QUERY AND RETURN DATA FRAME AS PANDAS
    df_map = session.sql(station_sql.format(long=long_off,lat=lat_off,rad=radius)).to_pandas()    

    return df_map

Data Frame Splitter

Next, add the split_df function and adjust any variable names to fit the app. This function will only be used as part of the display to paginate the results in a data frame.

##DATA SPLITTER
def split_df(input_df,rows):
    df = [input_df.loc[i : i + rows - 1, :] for i in range(0, len(input_df), rows)]
    return df

Transforming the Interface

With the groundwork laid, it was time to spruce up the presentation by splitting the interface into two columns – on the left, a dynamic map showcasing weather stations, and on the right, a tidy data frame with pagination controls.

app_cols = st.columns(2)

with app_cols[0]:
    #DISPLAY MAP
    st.map(df_map,use_container_width=True)

Pagination Controls

Using st.columns I add the pagination controls as well as the code to handle splitting the resulting data frame into the desired “chunks” for display.

with app_cols[1]:
    #ADD PAGINATION CONTROLS
    pg_menu = st.columns([4,1,1])
    #ADD BATCH SIZE PICKER
    with pg_menu[2]:
        pg_size = st.selectbox("Page Size",options=[10,25,50,100])
    #ADD PAGE PICKER
    with pg_menu[1]:
        total_pages = (
        int(len(df_map) / pg_size) if int(len(df_map) / pg_size) > 0 else 1
        )
        current_page = st.number_input(
            "Page", min_value=1, max_value=total_pages, step=1
        )
    with pg_menu[0]:
        #DISPLAY CURRENT PAGE
        st.markdown(f"Page **{current_page}** of **{total_pages}** ")
    #PAGINATE UNDERLYING DATA
    df_chart = split_df(df_map,pg_size)
    #DISPLAY DATA
    st.dataframe(df_chart[current_page-1],use_container_width=True)

Final App Display

Conclusion

Adding pagination controls to a Streamlit in Snowflake app can be done quite succinctly and adds a nice touch to your app when returning large amounts of data to the screen. Other enhancements to further extend the pagination controls could include dynamic page size options based on the output – or dynamic filters – or even sorting controls like in the original article which I did not include in this example.

Streamlit continues to impress as a rapid development tool and the ability to run natively in Snowflake has shorted that development cycle.

Full application code is available in my Github Repo: Snowflake Demos

Exploring NOAA Weather Stations: Mapping Locations Within Snowflake Using Streamlit

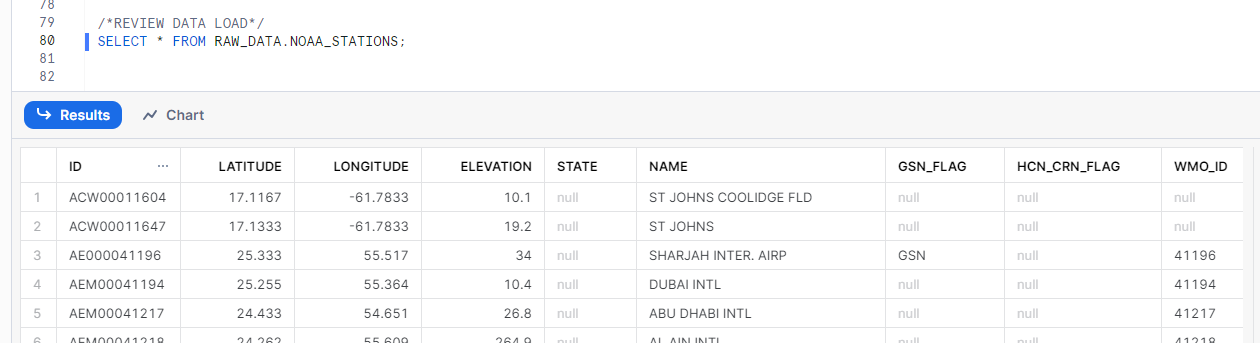
Previously, I walked through loading NOAA Weather Station location data from NOAA’s public S3 bucket into Snowflake, but what now? We have a list of hundreds of weather stations with coordinates, but what can we do with them? What if we plotted them on a map, but only showed those stations within a certain distance of a known point? This use case allows us to use a Streamlit in Snowflake widget as well as Snowflake’s Geospatial functions to quickly map station locations.

Before we get started, the code shown in this demo assumes the following:

  1. NOAA Weather Station loaded in Snowflake from the prior demo
  2. Objects needed to support Streamlit in Snowflake are in place from prior demos (database, warehouse, etc.).

Streamlit Setup

Before diving into Python to generate the Streamlit app, we’ll first set up the Snowflake objects needed to run the Streamlit app. In the setup script below, we create a new internal Snowflake stage specific to our new app, followed by the creation of the Streamlit object itself. Note that the “MAIN_FILE” parameter is set to ‘noaa_weather_stations.py’. You’ll need to make sure this parameter matches the Python file name you’ll upload to the stage.

Finally, grant USAGE on the app to the appropriate role for your use case. In my account, I have a role “ST_APP_USERS” that is inherited by other roles. By granting usage for ST_APP_USERS, I leverage Snowflake’s RBAC and Role Hierarchies to simplify my app access and security.

/*CREATE SCHEMA AND STAGES*/
USE ROLE ST_DEMO_ROLE;
/*SWTICH DB AND WAREHOUSE*/
USE DATABASE STREAMLIT_DB;
USE WAREHOUSE STREAMLIT_XS_WH;
/*SWITCH TO SCHEMA*/
USE SCHEMA STREAMLIT_STAGES;
/*CREATE STAGE WITH DIRECTORY*/
CREATE STAGE STG_NOAA_WEATHER
    DIRECTORY = (ENABLE=TRUE);
/*USE APPS SCHEMA*/
USE SCHEMA STREAMLIT_APPS;

/*CREATE STREAMLIT APP*/
CREATE STREAMLIT NOAA_WEATHER_STATIONS
    ROOT_LOCATION = '@STREAMLIT_DB.STREAMLIT_STAGES.STG_NOAA_WEATHER'
    MAIN_FILE = 'noaa_weather_stations.py'
    QUERY_WAREHOUSE = STREAMLIT_XS_WH
    COMMENT = 'Display Location of NOAA Weather Stations';
	
/*GRANT PRIVILEGES TO APP USERS ROLE TO RUN APP*/
USE SCHEMA STREAMLIT_DB.STREAMLIT_APPS;
GRANT USAGE ON STREAMLIT NOAA_WEATHER_STATIONS TO ROLE ST_APP_USERS;

Coding the App

In your favorite Python IDE or text editor, create a new .py file and name it ‘noaa_weather_stations.py’ (or whatever you set your MAIN_FILE parameter to above).

Import Libraries

Start by importing the necessary libraries to run Streamlit in Snowflake or a standalone Streamlit app. The Streamlit app we’ll build can run standalone or within Snowflake. Running the app outside of Snowflake opens up more options with the mapping widget and a few others; however, I’m only including options that function in both flavors so the code can run wherever you choose.

#IMPORT STREAMLIT LIBRARY
import streamlit as st
#IMPORT SNOWPARK
import snowflake.snowpark as sp
#IMPORT SNOWPARK SESSION
from snowflake.snowpark.context import get_active_session

Connect to Snowflake

Next, create a function to build the Snowflake connection. Why use a function? I like this setup when I’m testing Streamlit and want to run it as a stand-alone app or from within Snowflake. It allows the configuration of the connection as needed without constantly changing the code. In this demo, I’m using a username/password in plain text from a dictionary, note this is not the best security practice, but is sufficient for demo purposes.

The function open_session() will attempt to use get_active_session() from Snowflake first, if that causes an exception, then a connection is established using the credentials provided.

##CREATE NEW FUNCTION TO TRY GET ACTIVE SESSION FROM SNOWPARK
##OTHERWISE BUILD CONNECTION
def open_session():
    snow_session = None

    try:
      snow_session = get_active_session()
    except:
      #READ CREDS INTO DICTIONARY
        creds = {
            "account":"YOUR ACCOUNT",
            "user":"YOUR USERNAME",
            "password":"YOUR PASSWORD",    
            "database":"YOUR DATABASE",
            "schema":"YOUR SCHEMA",
            "role":"YOUR ROLE",
            "warehouse":"YOUR WAREHOUSE"
        }        
        #BUILD SESSION
        snow_session = sp.Session.builder.configs(creds).create()

    return snow_session


#CREATE A SESSION VARIABLE
session = open_session()

Identify Points of Origin

For simplicity, we’ll specify a few specific locations that will serve as the point of origin for plotting the weather stations. I chose five Snowflake office locations listed on their website and used the map links they provided to capture the Latitude and Longitude of each office. We’ll need this for the distance calculations. Add these locations to a dictionary variable that we’ll use throughout the demo.

office_locations = {
    "offices":{
        "Bozeman, MT":{
            "Latitude":"45.6779796",
            "Longitude":"-111.0348163"
        },
        "San Mateo, CA":{
            "Latitude":"37.553252",
            "Longitude":"-122.3062339"
        },
        "Bellevue, WA":{
            "Latitude":"47.6183091",
            "Longitude":"-122.1969603"
        },
        "New York, NY":{
            "Latitude":"40.7544099",
            "Longitude":"-73.9856036"
        },
        "Atlanta, GA":{
            "Latitude":"33.8460342",
            "Longitude":"-84.37203"
        }
    }
}

Add Input Widgets

First up on our app are the header and the input widgets to set our point of origin and radius distance in miles. I chose to use a column layout to keep things organized and limit the sizes of the selectboxes. My initial setup didn’t use columns and the select boxes were HUGE!

Additionally, we’ll use the input values to capture the Lat/Long of the chosen Snowflake office location for our query.

#GIVE THE PAGE A TITLE
st.header("NOAA Weather Station Location")


##ADD SOME COLUMNS FOR SELECTION BOXES
col1,col2,col3 = st.columns([1,1,3])
with col1:
    snow_office = st.selectbox(label="Choose a Snowflake Location:",options=sorted(office_locations["offices"]))
with col2:
    radius = st.selectbox(label="Radius (in miles)",options=[10,15,25,50,100])

#CAPTURE OFFICE LAT/LONG FROM DICT
lat_off = office_locations["offices"][snow_office]["Latitude"]
long_off = office_locations["offices"][snow_office]["Longitude"]

Identifying Stations

To identify weather stations within our specified distance, we’ll have to use two of Snowflake’s Geospatial functions – ST_MAKEPOINT and ST_DWITHIN. ST_MAKEPOINT creates a geography point from an input longitude and latitude. Why is that important? The other Geospatial functions like ST_DISTANCE or ST_DWITHIN require the inputs to be geography objects. ST_DWITHIN returns a boolean value indicating if the distance between two points is within a set distance in meters. In our app we specify the distance in miles, so we’ll do a rough conversion by multiplying the miles value by 1609 to get an approximation in meters.

We’ll set up a Python string for the station_sql first, using placeholders for the point of origin lat/long and the distance in miles. Next, load the query results into a data frame using station_sql.format() to substitute desired values for our placeholders.

 #GET THE NOAA WEATHER STATIONS WITHIN THE RADIUS SPECIFIED
station_sql = """
SELECT LONGITUDE,LATITUDE FROM ST_DEMO_DB.RAW_DATA.NOAA_STATIONS
WHERE ST_DWITHIN(ST_MAKEPOINT(LONGITUDE,LATITUDE),ST_MAKEPOINT({long},{lat}),{rad}*1609)
"""

#FORMAT THE QUERY AND RETURN DATA FRAME
df_map = session.sql(station_sql.format(long=long_off,lat=lat_off,rad=radius))

Map the Stations

Next, we’ll add a descriptive line of text indicating what we’re showing on the map – again using a base string and the format function. Last, but not least, add the map with st.map().

st.map() displays a scatterplot where the data point locations are defined by a LAT/LONG pair. In a stand-alone Streamlit app, other attributes such as point size and color can be specified; however, these attributes are not available in Streamlit in Snowflake yet, so I’ve left them out for now.

#USE LAT/LONG DATA FROM DF TO PLOT WEATHER STATIONS
disp_text = """
Showing NOAA weather stations within {rad} miles of {office} ({lat},{long})
"""
st.write(disp_text.format(rad=radius,office=snow_office,lat=lat_off,long=long_off))
#PLOT STATIONS ON MAP
st.map(df_map)

Deploy the App

Once you’ve saved your .py file locally, log in to your Snowflake account and upload it to the stage created during the setup. Next, navigate to your list of Streamlit apps and run the NOAA_WEATHER_STATIONS app.

If all goes according to plan, when the app finishes baking, you should see something similar to this:

Notice that as you change the office location and/or the distance option, how the map refreshes automatically.

Conclusion

In this demo, we set up a new Streamlit in Snowflake app to display weather station locations within a specified distance from a point of origin. While the points of origin were specified, the app could be extended to include more robust map searches through external API calls or other data sets.

The full set of setup SQL and the app code is available on my Snowflake Demo repository.

Snowflake: Loading a Fixed-Width File

Snowflake boasts powerful import capabilities from data files including CSV, JSON, and Parquet. What about a less frequently used file type – the fixed-width file? Yep! Snowflake can handle that with ease.

A fixed-width text file is a type of data file where each line contains records of a predetermined length, with fields aligned in columns of fixed widths. Unlike delimited files where fields are separated by a character like a comma or a tab, fixed-width files have specific character positions for each field. They are commonly used in “legacy systems” or applications that rely on strict formatting.

Loading data from a fixed-width file in Snowflake follows the same process as loading a CSV or other delimited text file. The primary differences are the options set in the file format object and whether you choose to “pre-load” the data into a staging table first.

In this tutorial, I’ll walk through a real example of loading a fixed-width data file I used for a recent data project. This example connects to a National Oceanic and Atmospheric Administration (NOAA) public Amazon S3 bucket. The data set we’re after is the weather station location data which includes the station names and coordinates.

Step 1: Create an External Stage

We’ll create an external stage in Snowflake to access the data stored in the S3 bucket. This stage acts as a reference to the location of the data without physically copying it into Snowflake storage. I like to use a specific schema for external stages which helps organize objects into logical blocks.

/*CREATE SCHEMA FOR EXTERNAL STAGES*/
CREATE OR REPLACE SCHEMA EXTERNAL_STAGES;

/*CREATE THE STAGE*/
CREATE OR REPLACE STAGE NOAA_S3
    URL = 's3://noaa-ghcn-pds/'
    DIRECTORY = (ENABLE=FALSE);

Step 2: Create a File Format

Next, we define a file format to interpret the structure of the fixed-width files in the S3 bucket. The primary difference between a fixed-width file format and a delimited file format is that the FIELD_DELIMITER option is set to NONE for the fixed-width format. Using the format below will read lines (rows) in the file as a single column.

/*CREATE THE FILE FORMAT*/
CREATE OR REPLACE FILE FORMAT EXTERNAL_STAGES.NOAA_FIXED_WIDTH
    TYPE = CSV
    FIELD_DELIMITER = NONE /*NO DELIMITER ON A FIXED WIDTH*/
    ;

Step 3: Create the Target Table in Snowflake

Before we can load the data from the S3 bucket into a Snowflake table, we have to create the target table. The NOAA S3 bucket includes a readme.txt file that defines the column spacing for the station file (ghcnd-stations.txt) file we’ll load. Use that definition to create our target table in the RAW_DATA schema created in an earlier demo.

IV. FORMAT OF "ghcnd-stations.txt"
------------------------------
Variable Columns Type
------------------------------
ID 1-11 Character
LATITUDE 13-20 Real
LONGITUDE 22-30 Real
ELEVATION 32-37 Real
STATE 39-40 Character
NAME 42-71 Character
GSN FLAG 73-75 Character
HCN/CRN FLAG 77-79 Character
WMO ID 81-85 Character
------------------------------
/*CREATE TARGET TABLE*/
CREATE OR REPLACE TRANSIENT TABLE RAW_DATA.NOAA_STATIONS(
    ID VARCHAR(11)
    ,LATITUDE FLOAT
    ,LONGITUDE FLOAT
    ,ELEVATION FLOAT
    ,STATE VARCHAR(2)
    ,NAME VARCHAR(30)
    ,GSN_FLAG VARCHAR(3)
    ,HCN_CRN_FLAG VARCHAR(3)
    ,WMO_ID VARCHAR(5)
);

Step 4: Using SELECT and Dollar Sign Notation to Parse the File

An advantage to using the external stage in Snowflake is that we can query the data files directly in the stage using dollar sign notation. In our example of the fixed width file, using $1 in the select query returns the data from the first (only) column in the file.

Using the data layout from the readme.txt file and combining a few SQL functions, we can parse the fixed-width record from a single column into the appropriate columns and data types using a SELECT statement; however, you’ll see that we use the stage and file name in the FROM clause like a table name and also include the FILE_FORMAT option so Snowflake knows how to interpret the file.

SELECT
NULLIF(TRIM(SUBSTRING($1,1,11)),'')::VARCHAR AS ID,
NULLIF(TRIM(SUBSTRING($1,13,8)),'')::FLOAT AS LATITUDE,
…
FROM
@EXTERNAL_STAGES.NOAA_S3/ghcnd-stations.txt
(FILE_FORMAT=>EXTERNAL_STAGES.NOAA_FIXED_WIDTH);

In the query above, we’re first using SUBSTRING to retrieve a portion of the first column in the file. Use the readme.txt file to assist with setting the starting position and length passed to the SUBSTRING. Next, we’re trimming any leading and trailing spaces from the string using TRIM. If the TRIM results in an empty string, we’ll set the value to NULL using NULLIF. Finally, we use :: to cast the resulting string into the appropriate data type.

Step 5: Loading the Data into Snowflake with COPY INTO

Using the SELECT statement prepared in the previous step we can load the data directly into our target table using the COPY INTO command. COPY INTO does exactly what it sounds like – it copies data into a table from another source.

/*TRUNCATE AND LOAD THE TABLE DIRECT*/
TRUNCATE TABLE RAW_DATA.NOAA_STATIONS;

/*LOAD THE DATA BY QUERYING THE FILE DIRECTLY*/
COPY INTO RAW_DATA.NOAA_STATIONS
FROM
(
    SELECT
        NULLIF(TRIM(SUBSTRING($1,1,11)),'')::VARCHAR AS ID
        ,NULLIF(TRIM(SUBSTRING($1,13,8)),'')::FLOAT AS LATITUDE
        ,NULLIF(TRIM(SUBSTRING($1,22,9)),'')::FLOAT AS LONGITUDE
        ,NULLIF(TRIM(SUBSTRING($1,32,6)),'')::FLOAT AS ELEVATION
        ,NULLIF(TRIM(SUBSTRING($1,39,2)),'')::VARCHAR AS STATE
        ,NULLIF(TRIM(SUBSTRING($1,42,30)),'')::VARCHAR AS NAME
        ,NULLIF(TRIM(SUBSTRING($1,73,3)),'')::VARCHAR AS GSN_FLAG
        ,NULLIF(TRIM(SUBSTRING($1,77,3)),'')::VARCHAR AS HCN_CRN_FLAG
        ,NULLIF(TRIM(SUBSTRING($1,81,6)),'')::VARCHAR AS WMO_ID
    FROM
        @EXTERNAL_STAGES.NOAA_S3/ghcnd-stations.txt
        (FILE_FORMAT=>EXTERNAL_STAGES.NOAA_FIXED_WIDTH)
);

After loading the data, Snowflake provides a status of the load indicating how many records were loaded and how many errors were encountered. More information about error handling and error limits is available in the Snowflake COPY INTO documentation.

COPY INTO results

Step 5: Reviewing Data Load

Finally, let’s verify that the data has been successfully loaded into the Snowflake table with a simple SELECT statement.

SELECT * FROM RAW_DATA.NOAA_STATIONS;
RAW_DATA.NOAA_STATIONS output

Conclusion

In this tutorial, we’ve demonstrated how to set up a fixed-width data pipeline in Snowflake to ingest NOAA weather data from a public S3 bucket. Snowflake’s flexibility to connect to other cloud storage solutions as well as the powerful SQL tools help eliminate some of the barriers to traditional data pipelines.